
In today’s highly competitive digital world, performance is the key to retaining visitors, enhancing user experience, and optimizing SEO rankings.
According to studies, even a 1-second delay in page load time can lead to a 7% reduction in conversions. Therefore, developers must ensure that their websites are optimized for speed, efficiency, and scalability. But how do developers know if their websites are up to par?
This is where web performance testing tools come into play. These tools help identify areas for improvement, track performance over time, and ultimately ensure that users have the best experience possible. Whether you’re working on a small blog or a massive eCommerce platform, the best web performance testing tools are essential to ensuring your site runs smoothly.
In this comprehensive guide, we’ll explore the 7 best web performance testing tools every developer should be using. From industry standards like Google Lighthouse to advanced tools like New Relic, each of these tools offers unique features designed to cater to specific testing needs.
Let’s dive into the top tools that will help optimize your website’s performance and improve your overall user experience.
What Are Web Performance Testing Tools?
Before we dive into the specific tools, it’s important to understand what web performance testing tools are and why they’re crucial for modern web development.
Definition and Importance of Web Performance Testing
Web performance testing refers to the process of evaluating how quickly and efficiently a website performs under different conditions. It involves measuring key metrics like page load time, server response time, and the overall user experience. These tests help developers identify performance bottlenecks—such as slow loading times, resource-heavy pages, or inefficient code—that can degrade user experience, increase bounce rates, and hurt SEO rankings.
In addition to load times, web performance testing tools assess other critical aspects, such as:
- Page size: The total size of all the resources (HTML, CSS, images, scripts) on a webpage.
- Time to First Byte (TTFB): The amount of time it takes for the browser to receive the first byte of data from the server.
- Render time: The time it takes for a page to render on a user’s screen.
With such valuable insights, performance testing tools are indispensable for developers aiming to optimize the user experience and keep their websites performing at their best.
Key Features of Effective Performance Testing Tools
Here are some of the key features you should look for when selecting a web performance testing tool:
- Comprehensive Reports: A tool should provide clear and detailed performance reports that offer actionable insights.
- Multiple Test Locations: Testing from different global locations gives you a better understanding of how users from various regions experience your website.
- Mobile & Desktop Testing: With mobile traffic increasing year over year, it’s essential to test on both mobile and desktop devices.
- Real-Time Monitoring: Continuous monitoring lets you track your website’s performance and catch issues as they arise.
- Integration with Development Tools: Tools that integrate seamlessly into your existing workflow (e.g., CI/CD pipelines) help streamline the testing process.
How to Choose the Right Web Performance Testing Tool
With numerous options available, selecting the right performance testing tool can be challenging. Here are the key factors to consider when choosing the best web performance testing tools for your website.
Understanding Your Project’s Needs
The first step in choosing the right tool is to assess your website’s needs. Does your site rely heavily on media assets like images, videos, or animations? Are you dealing with dynamic content or complex web applications? Understanding the unique needs of your project will help you determine the best tools to evaluate and optimize its performance.
For example, if you’re working on an eCommerce site with a global customer base, you might want a tool that provides multi-location testing and real-time monitoring. On the other hand, if you’re developing a simple blog or static site, a tool like Google Lighthouse might be sufficient.
Factors to Consider When Selecting a Tool
Here are some key factors that can help you choose the right tool:
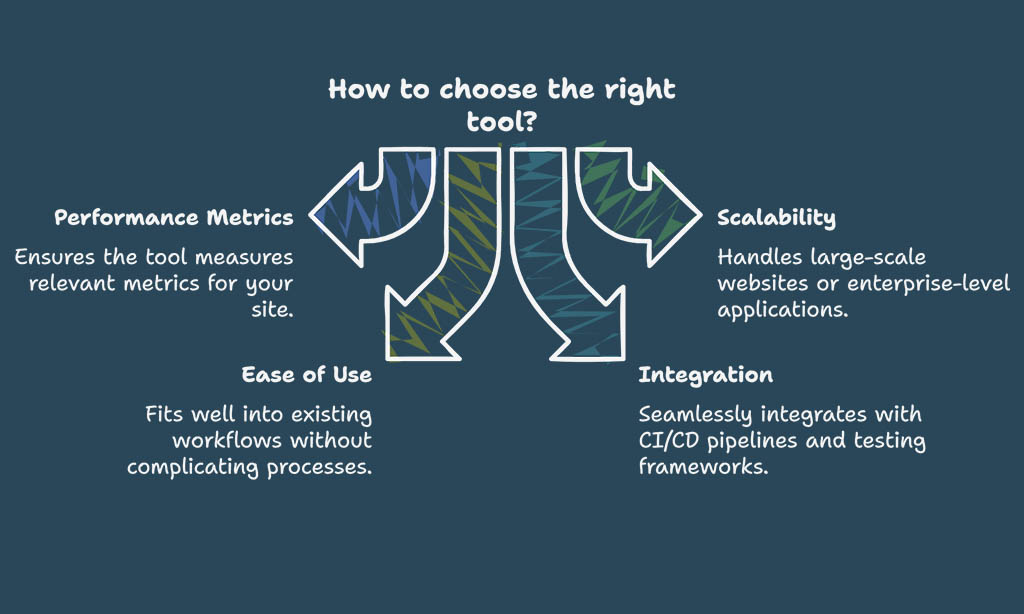
- Performance Metrics: Does the tool measure the metrics that are most relevant to your site, such as load time, resource requests, or SEO-related factors?
- Scalability: Can the tool handle large-scale websites or enterprise-level applications? Some tools are better suited for small projects, while others are designed to test large, complex systems.
- Ease of Use: Choose a tool that’s user-friendly and fits well into your existing workflow. Overly complicated tools can slow down the development process.
- Integration with Your Workflow: Tools that integrate with your CI/CD pipelines, testing frameworks, and version control systems can streamline performance testing during the development process.
7 Best Web Performance Testing Tools Every Developer Needs
Now that we’ve covered the essentials, let’s dive into the 7 best web performance testing tools every developer needs to know about. Each of these tools offers unique features that cater to different aspects of performance testing.
1. Google Lighthouse
Overview and Key Features
Google Lighthouse is an open-source, automated tool that helps developers improve the quality of their web pages. It audits websites for performance, accessibility, SEO, and best practices. Lighthouse generates a detailed report, scoring websites across various categories such as:
- Performance: Measures page load time, render time, and other core web vitals.
- Accessibility: Evaluates how accessible a website is to users with disabilities.
- SEO: Provides insights into SEO factors such as meta tags, headings, and more.
- Best Practices: Analyzes whether a site follows the latest best practices for web development.
Lighthouse is free to use and integrates with Chrome DevTools for easy access.
Key Benefits
- Free and open-source
- Detailed and actionable performance reports
- Easily integrates with Chrome DevTools
Google Lighthouse Features
| Feature | Description |
| Performance Audit | Measures key performance metrics (load time, TTFB) |
| Accessibility Audit | Checks for WCAG accessibility issues |
| SEO Audit | Reviews SEO factors like meta tags, image alt text |
| Integration with Chrome DevTools | Available directly in Chrome for easy access |
How to Use Google Lighthouse for Testing
- Open Google Chrome and navigate to the desired website.
- Right-click and select “Inspect” to open DevTools.
- Go to the “Lighthouse” tab and click “Generate Report.”
2. GTmetrix
Overview and Key Features
GTmetrix is one of the most widely used performance testing tools. It offers detailed analysis of your website’s load times, page size, and the number of requests. It provides a comprehensive report based on both Google Lighthouse and Web Vitals. GTmetrix also offers valuable insights into potential improvements such as image optimization, script minification, and lazy loading.
Key Benefits
- Comprehensive performance report
- Detailed waterfall chart to identify bottlenecks
- Mobile and desktop testing options
GTmetrix Key Metrics
| Metric | Description |
| Performance Score | A score based on page speed and load times |
| Page Load Time | Time taken for the page to fully load |
| Total Page Size | Total size of the page, including images and scripts |
| Waterfall Chart | Visual representation of resource loading and delays |
How GTmetrix Helps Developers
GTmetrix helps developers pinpoint exactly where the bottlenecks in their website’s performance lie. By showing a visual representation of how resources are loaded on the page, it allows for quick identification of slow elements, such as large images or inefficient scripts.
Interactive Elements: Sample GTmetrix report analysis.
3. WebPageTest

Overview and Key Features
WebPageTest is an advanced web performance testing tool that enables developers to test the performance of a website from different global locations. It supports various testing configurations, such as simulating different network speeds, testing multiple browsers, and using real-world devices.
WebPageTest’s detailed waterfall charts, first-byte times, and render times provide developers with granular insights into their site’s performance.
Key Benefits
- Multi-location testing to simulate global user experience
- Simulate mobile and desktop networks
- Detailed and in-depth testing reports
WebPageTest Features
| Feature | Description |
| Multi-location Testing | Test from different global locations |
| Device Simulation | Simulate performance on mobile and desktop devices |
| Advanced Testing Options | Customize network speed and testing conditions |
How to Use WebPageTest Effectively
WebPageTest allows for in-depth testing by offering advanced features like simulating slow 3G connections or testing websites across various devices and browsers. These features provide insights into how your website will perform for users across the globe with different internet speeds.
4. Pingdom
Overview and Key Features
Pingdom is a well-known website performance monitoring tool that provides real-time monitoring and uptime alerts. In addition to measuring page load times, Pingdom offers performance reports with insights into what elements are slowing down your website. It also tracks historical performance data, enabling developers to compare performance over time.
Key Benefits
- Real-time monitoring with uptime alerts
- Detailed performance reports with breakdowns by location
- User-friendly dashboard for tracking performance trends
Pingdom Features
| Feature | Description |
| Uptime Monitoring | Tracks website availability and alerts you when the site is down |
| Historical Data | Compares performance trends over time |
| Detailed Performance Breakdown | Provides in-depth reports on specific elements slowing down the site |
Practical Example: Using Pingdom for Ongoing Monitoring
For a developer managing an eCommerce platform, Pingdom offers invaluable support by tracking performance 24/7. With real-time monitoring and instant alerts, it ensures that any issues affecting performance or downtime are caught early, minimizing the impact on sales and customer experience.
Interactive Elements: Pingdom performance report example.
5. SpeedCurve
Overview and Key Features
SpeedCurve focuses on real user performance data and Core Web Vitals. It’s designed to help developers understand how their site’s performance affects the user experience. SpeedCurve tracks real user interactions, providing detailed reports that allow for continuous optimization.
Key Benefits
- Real user monitoring (RUM)
- Tracks Core Web Vitals
- Real-time insights into performance issues
SpeedCurve Features
| Feature | Description |
| Real User Monitoring (RUM) | Tracks performance based on real user data |
| Core Web Vitals | Monitors essential web performance metrics like LCP, FID, and CLS |
| Performance Insights | Provides actionable insights on improving user experience |
Case Study: Using SpeedCurve for Continuous Improvement
A popular online retailer uses SpeedCurve to monitor how its site’s performance impacts customer retention. By tracking Core Web Vitals and user interactions, the company identifies areas for improvement, such as reducing server response times and optimizing images for faster load times.
6. YSlow
Overview and Key Features
YSlow, a tool developed by Yahoo, focuses on analyzing websites using predefined performance rules. It evaluates your website’s performance based on how well it follows best practices for web development. These rules include image optimization, proper caching, JavaScript and CSS minification, and leveraging browser caching, among others.
YSlow provides detailed feedback and suggestions on how to improve your website’s performance based on these rules. Although the tool has been around for a while, it is still widely used by developers to ensure that their websites comply with optimization standards.
Key Benefits
- Rule-based analysis: YSlow uses a set of predefined performance rules, making it easier for developers to follow best practices.
- Quick insights: It provides immediate feedback on performance issues, making it an ideal tool for quick checks.
- Browser-based tool: YSlow works as a browser extension for Chrome and Firefox, enabling developers to easily assess website performance during the development process.
YSlow Key Features
| Feature | Description |
| Performance Rules | Uses predefined best practices for web performance |
| Quick Performance Insights | Provides fast and actionable feedback |
| Browser Extension | Available as a Chrome/Firefox extension for easy testing |
Practical Example: Using YSlow for Rule-Based Testing
A web developer working on an eCommerce platform can use YSlow to ensure that the site is following all performance best practices. For example, the tool might suggest compressing images or enabling gzip compression, which would lead to improved load times and a better user experience.
Interactive Elements: YSlow performance rule example analysis.
7. New Relic
Overview and Key Features
New Relic is a powerful application performance monitoring tool that goes beyond traditional website speed testing. It offers real-time monitoring of web applications and helps developers trace the performance of various application layers, such as databases, servers, and third-party services.
New Relic is especially beneficial for large-scale websites and applications, as it allows for deep insights into performance issues across the entire stack.
New Relic’s performance monitoring includes not only page load times but also transaction tracing, error tracking, and detailed analytics that can help developers quickly identify and resolve performance bottlenecks.
Key Benefits
- Real-time monitoring: Provides live, actionable data on the performance of web applications.
- End-to-end application monitoring: Tracks performance across the entire web application stack (front-end, back-end, database, etc.).
- Scalable for enterprise use: Well-suited for large-scale applications with high traffic and complex architectures.
New Relic Features
| Feature | Description |
| Real-Time Monitoring | Monitors live performance data and offers alerts |
| Application Stack Monitoring | Tracks performance across all layers (front-end to back-end) |
| Transaction Tracing | Allows for deep tracing of individual transactions to pinpoint issues |
How New Relic Helps Developers at Scale
A large online service like a streaming platform could use New Relic to monitor the performance of individual components like video streaming, database queries, and user authentication. By using real-time monitoring and transaction tracing, New Relic helps developers quickly identify the root cause of performance issues—whether it’s a slow database query or a lag in video rendering—enabling rapid resolution and minimizing downtime.
Interactive Elements: New Relic transaction trace report.
Comparing the Top 7 Web Performance Testing Tools
Here’s a comprehensive comparison of the best web performance testing tools discussed above. This table highlights the key features, benefits, and the ideal use case for each tool.
| Tool | Key Features | Pricing | Best For |
| Google Lighthouse | Free, integrates with Chrome DevTools, detailed reports | Free | Quick audits, accessibility and SEO testing |
| GTmetrix | Detailed performance reports, waterfall charts, mobile testing | Free/Pro | Comprehensive website testing |
| WebPageTest | Multi-location testing, simulates mobile and desktop networks | Free/Pro | Global performance testing, detailed reporting |
| Pingdom | Real-time monitoring, uptime alerts, historical data | Paid | Ongoing performance monitoring, uptime tracking |
| SpeedCurve | Real user monitoring, Core Web Vitals tracking, actionable insights | Paid | Continuous real-time monitoring and UX tracking |
| YSlow | Rule-based analysis, quick insights, browser extension available | Free | Quick performance audits, rule-based checks |
| New Relic | Real-time monitoring, end-to-end application stack monitoring, transaction tracing | Paid | Large-scale web applications, deep performance insights |
Best Practices for Web Performance Testing
To fully leverage the power of these best web performance testing tools, developers should adopt a set of best practices. Here are some recommended strategies for conducting effective performance testing:
Regularly Test Performance Across Multiple Devices and Locations
Web performance can vary greatly depending on the user’s location and device type. Ensure that your website performs optimally for a global audience by testing it across various devices, browsers, and network conditions. Tools like WebPageTest and Pingdom allow you to simulate traffic from different regions, helping you understand how your site performs in real-world conditions.
Use Core Web Vitals as a Benchmark
Core Web Vitals (LCP, FID, and CLS) are now key ranking factors for Google. Ensure that you’re optimizing your website based on these metrics. Tools like SpeedCurve, Google Lighthouse, and GTmetrix provide in-depth insights into these web vitals, helping you track and improve them over time.
Automate Performance Testing
Automating your performance tests ensures that performance issues are detected as early as possible. Integrate performance tests into your CI/CD pipeline, so that every time a developer pushes a change, the performance of the site is automatically tested. Tools like Lighthouse and New Relic offer APIs and integrations that make it easier to automate these tests.
Prioritize Key Performance Metrics
Focus on optimizing the key performance metrics that matter most to your users. This includes page load time, First Contentful Paint (FCP), and Time to Interactive (TTI). These metrics are directly correlated with user experience, so improving them can have a significant impact on your site’s performance and user retention.
Implement Continuous Monitoring
Even after launch, ongoing performance monitoring is crucial. Tools like Pingdom and New Relic offer continuous monitoring, allowing developers to track site performance 24/7. This ensures that any issues are identified and addressed before they impact users.
Wrap Up
Web performance testing is a vital component of modern web development. By using the best web performance testing tools, developers can gain valuable insights into how their websites perform and identify areas for optimization.
Whether you’re using tools like Google Lighthouse for quick audits or New Relic for deep application monitoring, these tools provide the data needed to ensure your website runs smoothly.
With the right performance testing strategy in place, you can improve load times, enhance user experience, and boost your website’s search engine rankings. Start testing your website today and unlock the full potential of these best web performance testing tools to deliver a faster, more reliable website for your users.